BURRILLVILLE – Burrillville students had a higher dropout rate and lower rate of college attendance in recent years than the statewide average, and their math and reading skills also fell behind their peers in Rhode Island at several grade levels.
The data on how Burrillville measures up on education comes from the 2018 Rhode Island Kids Count Factbook, produced by a policy organization that publishes statewide indicators of childhood well-being annually. The nearly 200-page data book lays out information on adolescent poverty and health, as well as parental contributors such as the age of the mother, or incarceration of a caregiver, using the most recent figures available.
In many categories, Burrillville households with children measured up as average, or slightly better than average than the average, when compared with other communities across Rhode Island.
The Factbook estimated that between 2012 and 2015, 15.1 percent of children in Burrillville below the age of 18 were living below the poverty level, up from 6 percent in the year 2000. But the data on children statewide was even more dire, with 19.4 percent living below income standards.
The town showed a relatively low percent of reported incidents of child abuse and neglect when compared with other communities. There were 27 investigations of abuse and neglect in Burrillville in 2017, and indications that 6.4 of every 1,000 children in town were victims, a figure that jumps to 14.6 when examined across Rhode Island.
Thirty Burrillville children had incarcerated parents in 2017, or 8.4 of every thousand below the age of 18. In Rhode Island, 12.7 of every thousand kids had an incarcerated parent during the same year.
Of the children born to Burrillville parents between 2012 and 2016, 9.5 percent were preterm, slightly above the state average of 9 percent. Six percent had a low birthweight, a figure that jumps to 7.5 percent of babies statewide.
There were 27 births to teen girls, ages 15-19, in Burrillville during those same years, 11.2 out of every thousand, while statewide 15 out of every thousand kids were born to young mothers.
But many indicators of success in education showed Burrillville lagging behind.
- Between 2012 and 2016, only 33 percent of mothers of children under the age of 18 in Burrillville had a bachelor’s degree or above, compared to the state average of 35 percent.
- Burrillville schools had an 8 percent dropout rate in 2017, above the statewide average of 7 percent.
- 85 percent of Burrillville middle school and high school students said they planned to attend college in 2017, while 87 percent of Rhode Island students indicated they planned to attend.
- The number of 2016 graduates who enrolled in college within 6 months was 56 percent in Burrillville, and 59 percent across the state.
- In 2017, 19 percent of Burrillville students in grades 3 through 7 met expectations in math, while 27 percent of students did so across the state in the same grade levels.
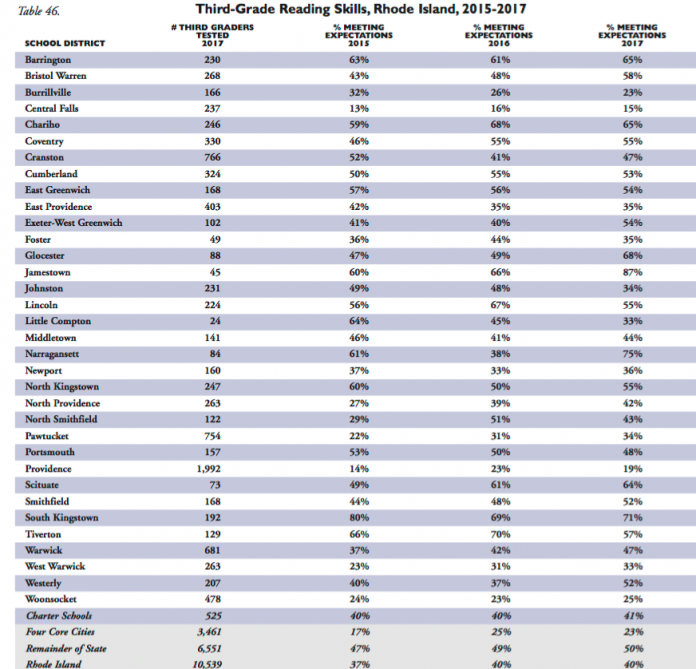
- Only 23 percent of Burrillville students in third grade were meeting reading skill expectations between 2015 and 2017, while 40 percent were statewide. The town’s figure was on par with the state’s “core cities” of Central Falls, Pawtucket, Providence and Woonsocket, where other factors such as poverty and crime were believed to have played a much larger role. By grade 7, however, Burrillville students had caught up – at least in reading – with 41 percent meeting expectations compared to the statewide average of 40 percent.
The data shows that Burrillville continues to be one of the less diverse communities in Rhode Island, with 92 percent of students enrolled in public school in 2017 identifying as “white,” while the statewide average was only 58 percent. Less than 1 percent of Burrillville students were English language learners, while 8 percent were learning English statewide.
Other facts taken from the book include:
- The median income of for a family with a child under the age of 18 fell from $79,407 in Burrillville in 1999, to $75,181 in 2012-2016, a decreasing trend seen through much of Rhode Island.
- Public schools identified 37 homeless children in Burrillville during the 2016/2017 school year.
- There were 46 temporary disability claims due to childbirth in Burrillville in 2017, and 88 claims for temporary caregivers.
- 44 children in town were born to single mothers in 2017.
- There were five assault and weapons offense among Burrillville juveniles in 2016 and 570 total across the state.
- Nine Burrillville kids were in the custody of Rhode Island Training School in 2017.
- 50 Burrillville children ages 3-5 received special education services in 2017, 11 percent of the total population.
- During the 2016/2017 school year, 26 Burrillville students received in-school suspension, and 160 received out-of-school suspension – 8 disciplinary actions for every 100 students, below the state average of 14 per 100.
The document, released last week, can be found in its entirety here.


